

I. Introduction
The landscape of software engineering has undergone a tectonic shift over the last decade. Historically, an application might have resided on a single monolithic server with a predictable relational database. Today, we operate in an era of hyper-complexity. Modern architectures are composed of fragmented microservices, distributed storage clusters, and multi-cloud environments. Consequently, this explosion of moving parts means that the “attack surface” for potential failures has expanded exponentially. This makes manual oversight not just difficult, but mathematically impossible.
The Evolution of Monitoring
As systems become more distributed, the interdependencies between components—such as service meshes and container runtimes—create a “black box” effect. Traditional IT maintenance, which relied on reactive troubleshooting when a server went offline, cannot survive in this environment. Furthermore, the need for constant availability requires a shift from simple “uptime” to comprehensive Observability. This shift is driven by global user bases and strict Service Level Agreements (SLAs) that demand near-zero downtime.
Monitoring systems have emerged as the foundational solution to this complexity. However, the legacy monitoring tools of the past are no longer sufficient. Specifically, tools that focused purely on “Ping” responses and basic CPU/RAM metrics were too rigid for today’s needs. They cannot adapt to the ephemeral nature of modern infrastructure, where a container might only exist for a few minutes. Modern observability now requires a deep integration into the lifecycle of every resource, whether it is a physical blade server or a serverless function.
The Role of Customization
The necessity for Personalized Monitoring Configurations has become paramount. Every business has unique logic; for instance, a 50% CPU load might be normal for a video encoding service but catastrophic for a high-frequency trading platform. Modern tools like Zabbix and Prometheus have revolutionized this space. They focus on customized virtualization, cloud-native hooks, and microservice-specific telemetry. Thus, they allow us to define “health” not by hardware status, but by the successful execution of business logic.
II. Solution with Architecture: Zabbix vs. Prometheus
While both systems offer enterprise-grade security through certificate-based encryption and mTLS, the choice between them involves distinct philosophies. Specifically, the decision lies in their Data Processing Philosophy and Operational Overhead.
1. Zabbix: The Logic-Heavy Specialist
Zabbix is designed for Deep Introspection. Its strength lies in its ability to process complex, multi-step logic at the edge (via agents) or on the server.


- State-Based Evaluation: Zabbix excels at State Tracking due to its relational SQL backend. Unlike simple threshold tools, it evaluates metrics within a complex historical context. For example, it can trigger an alert based on combined time ranges and previous states, such as “Alert if Error > 5 AND previous state was OK.”
- Custom Scripting Integration: It is also the king of custom Bash/Python business logic. Through the “UserParameter” feature, any script output can be transformed into a monitoring metric. This enables deep, domain-specific introspection that goes far beyond standard hardware sensors.
- Infrastructure Support: Zabbix handles “Static” infrastructure (VMs, Switches, SANs) better because it maintains a persistent record of every host’s identity and configuration.
- The Overhead: However, the cost of this flexibility is database I/O. Using a Relational Database means Zabbix can become a bottleneck if you try to ingest millions of metrics per second from short-lived containers.
2. Prometheus: The High-Throughput Statistician
Prometheus is designed for Mathematical Aggregation at scale. It focuses on the “behavior of the cluster” rather than the identity of a single container.


- The TSDB Advantage: Prometheus uses a Time-Series Database (TSDB). Unlike Zabbix’s SQL rows, a TSDB is an append-only system optimized for massive ingestion speeds. Therefore, it can handle data volumes that would crash a standard SQL database.
- PromQL Power: Prometheus is superior at Statistical Math. Using PromQL, you can calculate the “95th percentile latency of all API calls across 500 containers” in a single line. This is mathematically intensive and nearly impossible to do in real-time within a traditional SQL monitor.
The Practical Constraints of Prometheus
Despite its power, Prometheus has inherent weaknesses. Firstly, it is primarily a performance monitor, not a long-term data warehouse; its default retention is often as short as 15 days. Consequently, for year-over-year audits, you must implement external storage like Thanos. Secondly, it lacks “State” awareness, making it difficult to correlate events over long periods. Lastly, the “Exporter Tax” is high—every unique app requires a separate HTTP service (Exporter) to be maintained, which significantly increases the maintenance surface compared to Zabbix’s unified agent.
Comparison: Why We Use Both
| Dimension | Zabbix (Infrastructure/Business) | Prometheus (Cloud-Native/K8s) |
|---|---|---|
| Logic Complexity | High: Excellent for complex state logic. | Moderate: Focused on math thresholds. |
| Data Throughput | Limited by SQL I/O. | Massive due to TSDB optimization. |
| Maintenance | Simple: One agent for all custom scripts. | Heavy: Requires managing many Exporters. |
| Data Retention | Long-term: Persistent SQL records. | Short-term: Optimized for real-time math. |
III. Case Study: Security Auditing with jsonRAG
1. Introduction: Multi-Tenant Security Monitoring
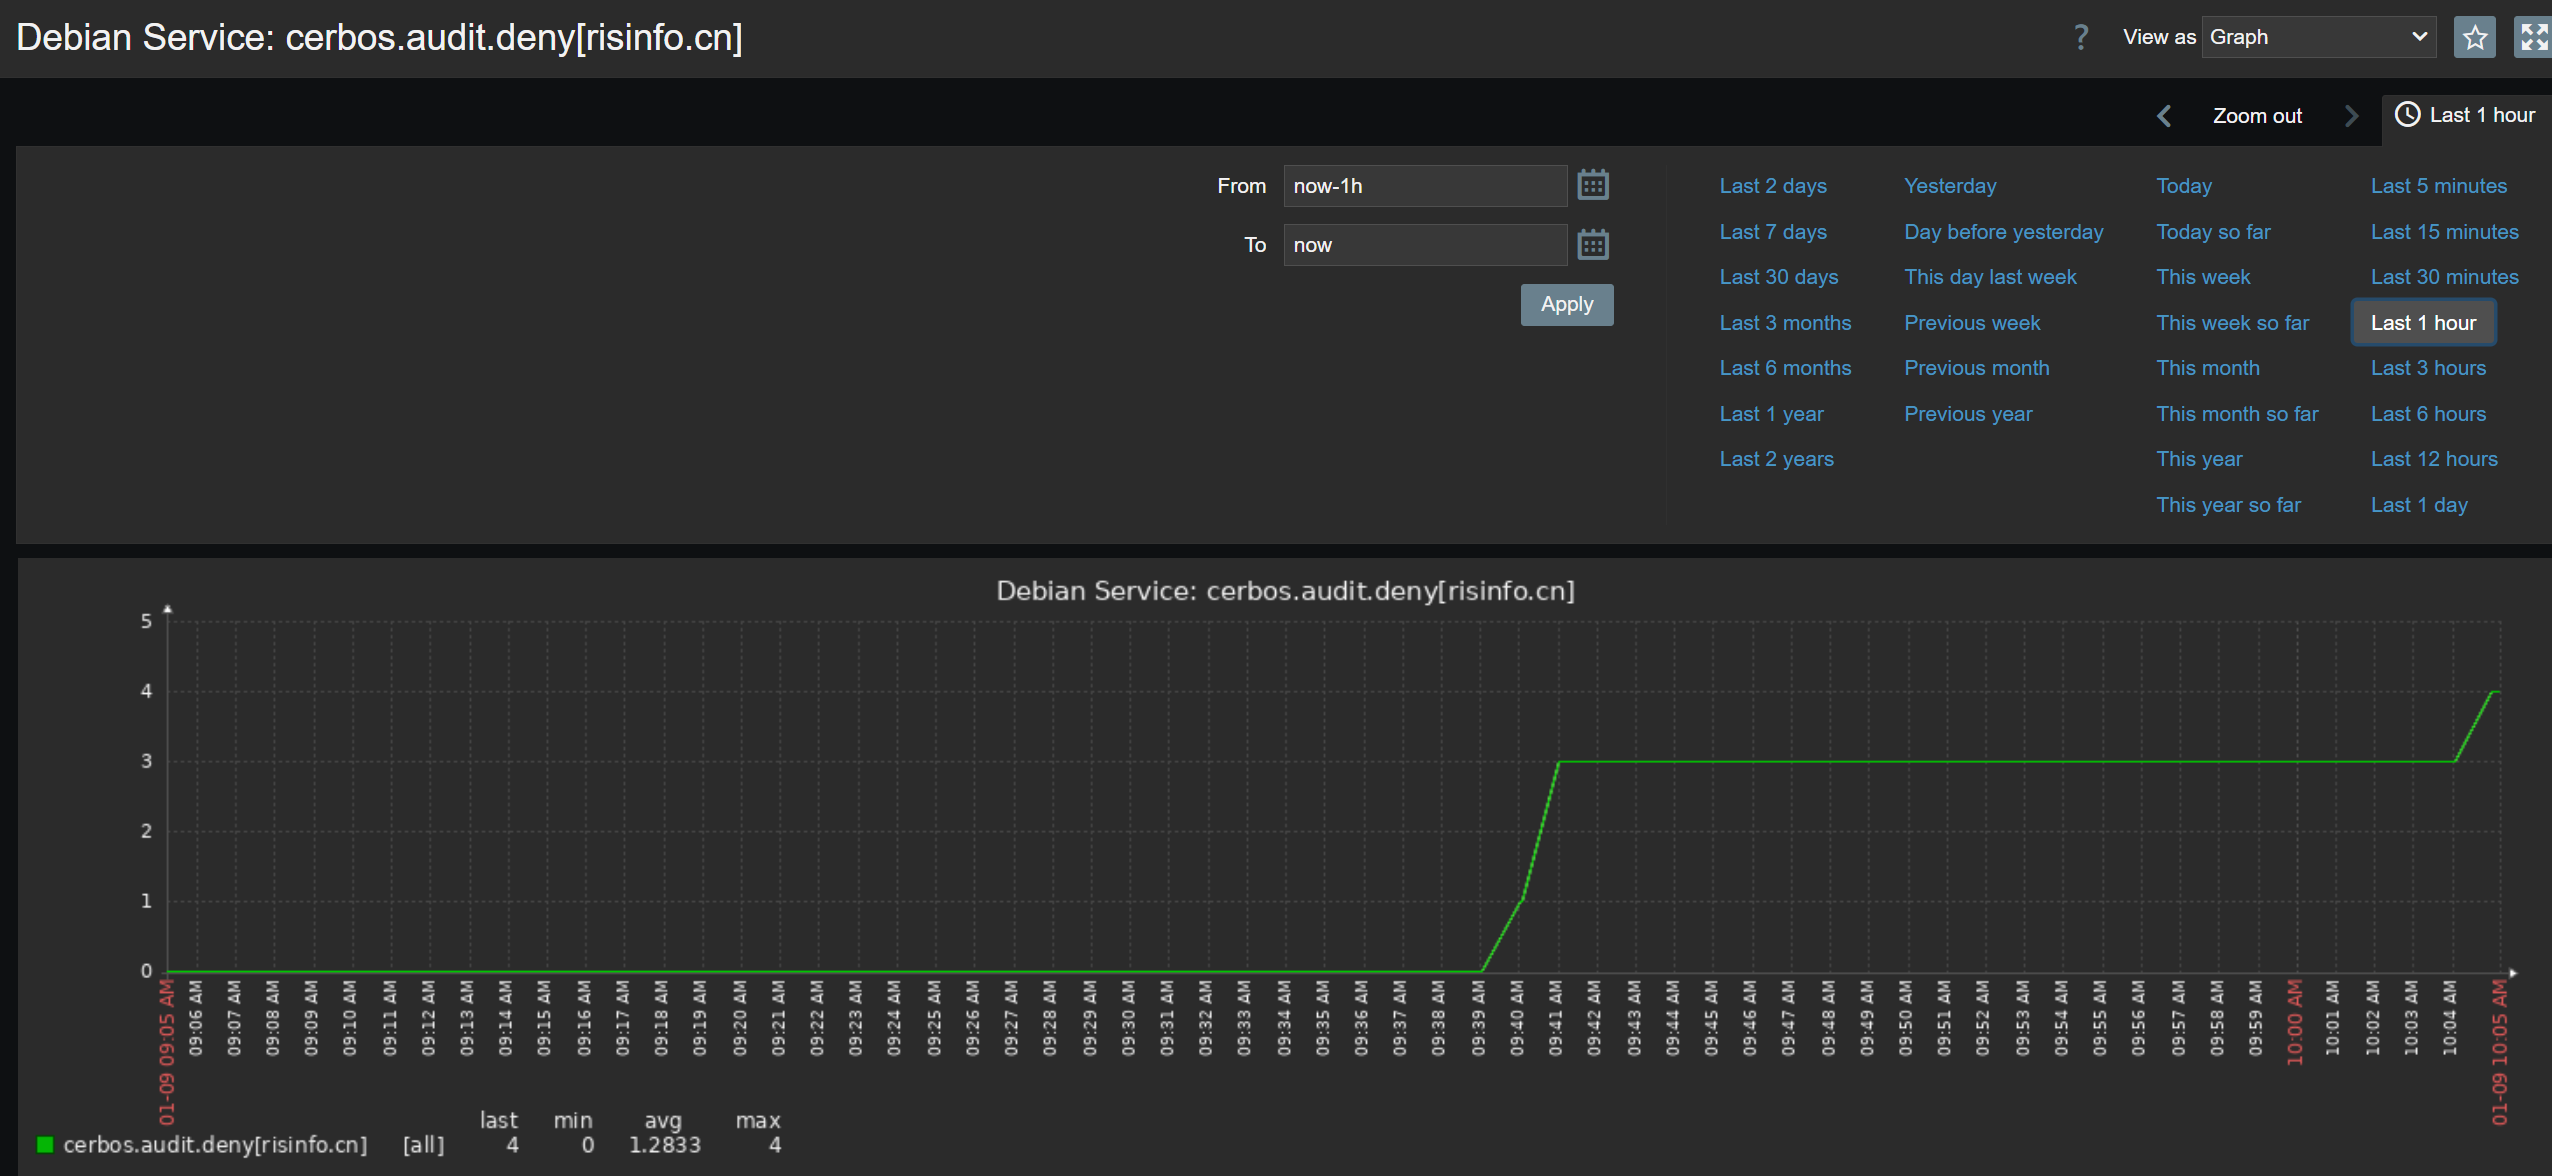
In the jsonRAG framework, authorization is managed by Cerbos. In a multi-tenant environment, monitoring must be “intelligent” enough to distinguish between routine system checks and actual user violations. To achieve this, we deployed a custom monitoring solution using the cerbos_audit_stats.sh script. This script acts as a bridge, providing real-time security telemetry for each tenant.
Operational Logic: The Full Alerting Loop
The following diagram illustrates the complete path from a security violation to an official notification received by the Operations (SRE) Team.

2. Implementation Details & Evidence
A. Data Ingestion: Distinguishing Noise from Reality
The script uses jq to isolate “Real Requests.” In the jsonRAG environment, system polling often sends batches of 3 actions. However, by checking if the action length is exactly 1, the script ignores background system noise and only counts actual user interactions that hit the audit log.
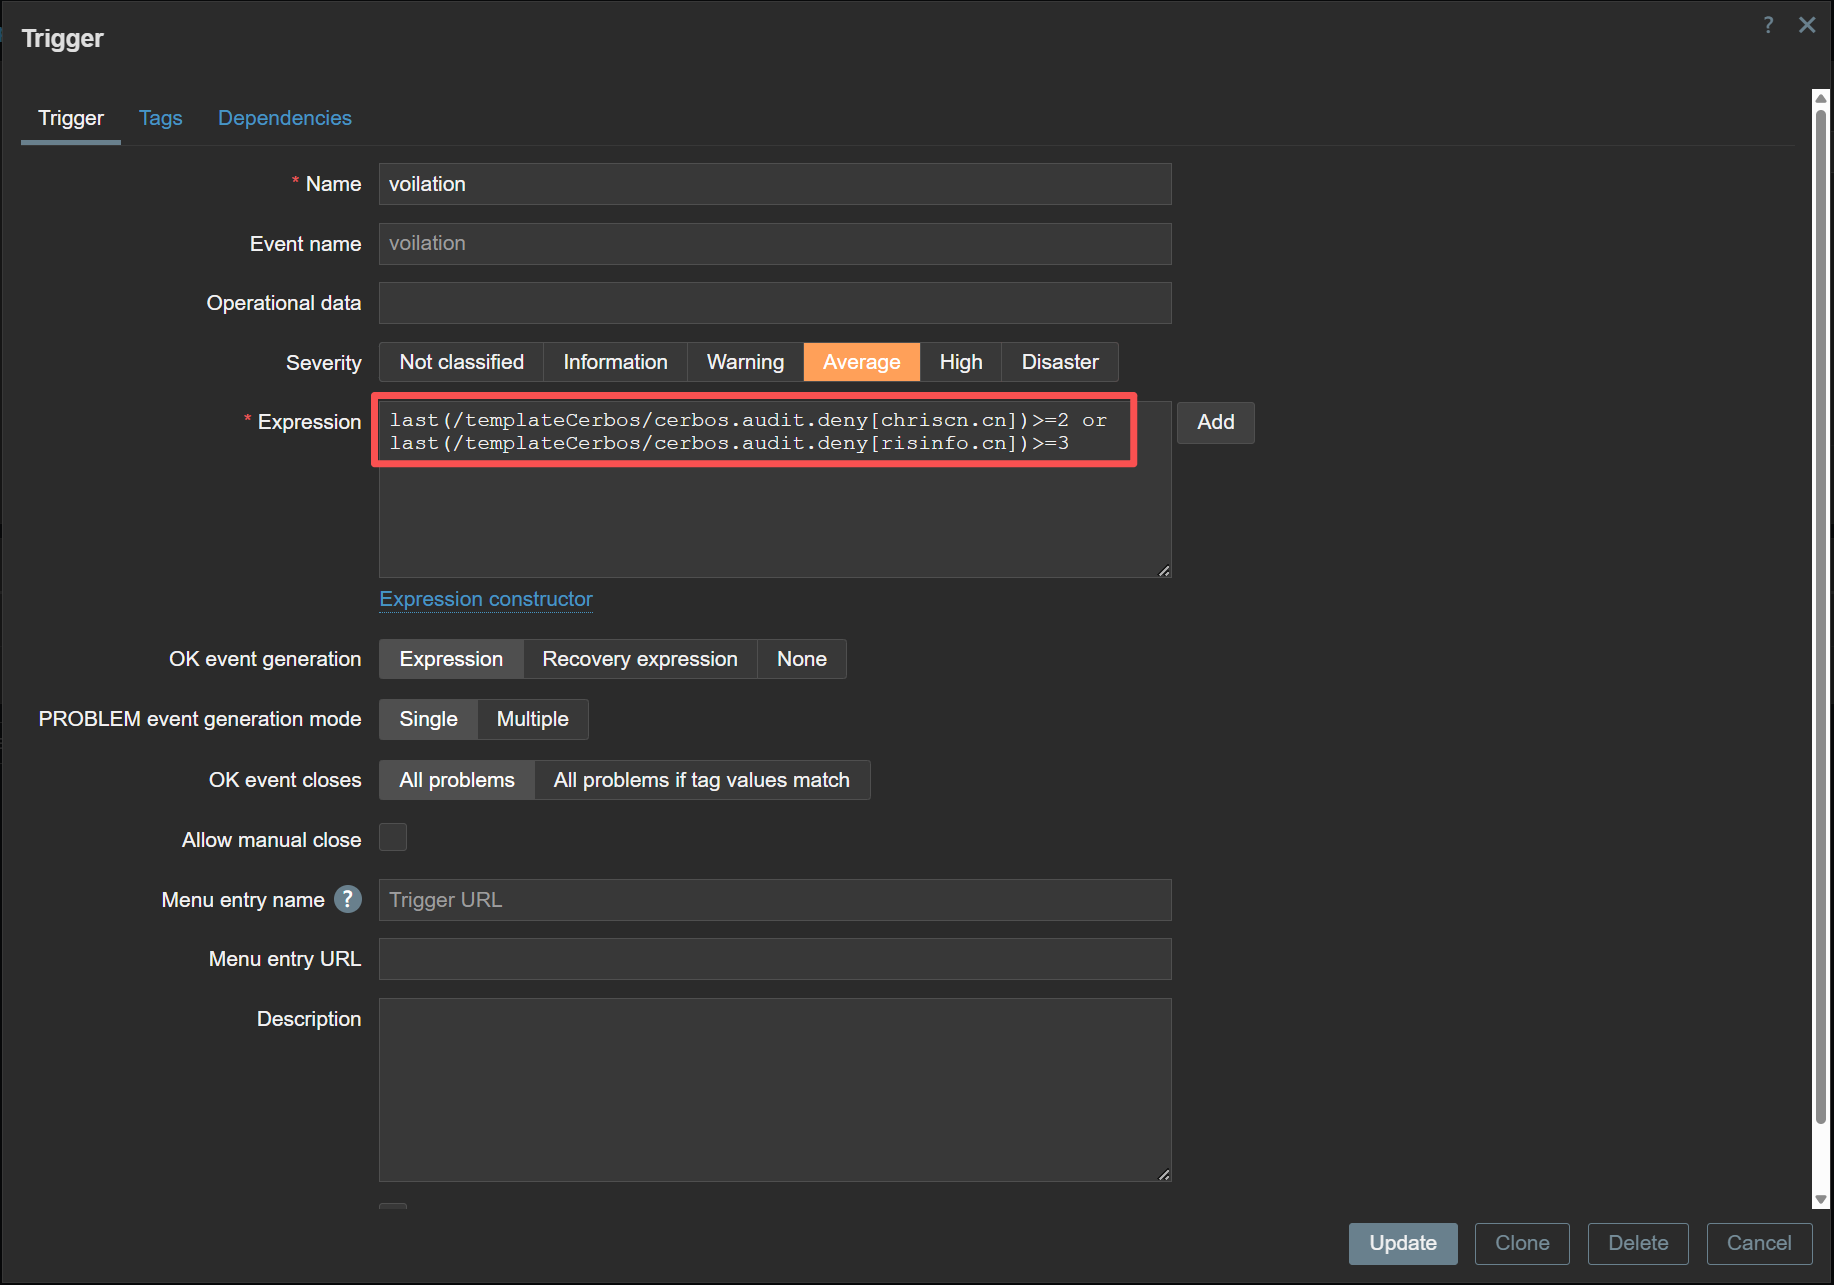
B. The Trigger: The Decision Point
The “Security Policy” is defined within the Zabbix Trigger Engine. We have configured a specific threshold: If a tenant violates permission requirements more than 3 times within a rolling hour, the state changes to “Problem.” This converts raw log data into an urgent operational event.
C. Active Response: Notifying the Owner
Once the PROBLEM event is generated, the Action Engine dispatches an alert to the platform owner or the SRE team. This ensures that even without a night-shift team, the people responsible for the platform are notified of potential brute-force attempts immediately.

IV. Chapter Summary: The Eyes of the System
In this section, we have seen how modern observability bridges the gap between complex architectures and limited human resources. By leveraging the specific strengths of Zabbix for deep logic and Prometheus for high-velocity cloud-native metrics, we achieve a comprehensive visibility layer. The jsonRAG case study demonstrated that with the right scripting logic and automated Webhooks, we can catch security breaches in real-time.
Application Resilience
Beyond monitoring, we deploy high-availability Application Clusters. By utilizing load balancers and synchronized service nodes, the system can automatically bypass failed instances. Consequently, this ensures that the business remains operational even during partial service outages.
Coming Next: Resilience—Part 2: High-Availability (HA) Infrastructure
In the second part of this chapter, “3. Observability & Resilience: Part 2,” we will pivot from seeing problems to surviving them. We will move beyond simple monitoring to discuss why a High-Availability architecture is a non-negotiable necessity for any Modern SaaS provider.
What we will cover:
- The Necessity of HA in Modern SaaS: Why “uptime” is no longer just a metric, but the core of customer trust and security. We will analyze the cost of failure in a distributed world.
- Resilient Architecture Analysis: A deep dive into the “Self-Healing” stack. We explore how to eliminate single points of failure through architectural redundancy.
- Data Synchronization & Integrity: Discussing the logic of synchronized clusters. We examine how to maintain data consistency across distributed nodes without sacrificing performance.
- Rapid Recovery & Hypervisor Strategy: How to utilize Proxmox/ESXi virtualization layers to ensure corrupted systems can be restored to a clean state in minutes while maintaining service continuity.
Stay tuned as we reveal how to build a data fortress that remains fully operational even while hardware or software components are under fire.